

Is Langley’s Debt $421 Million or $861 Million?
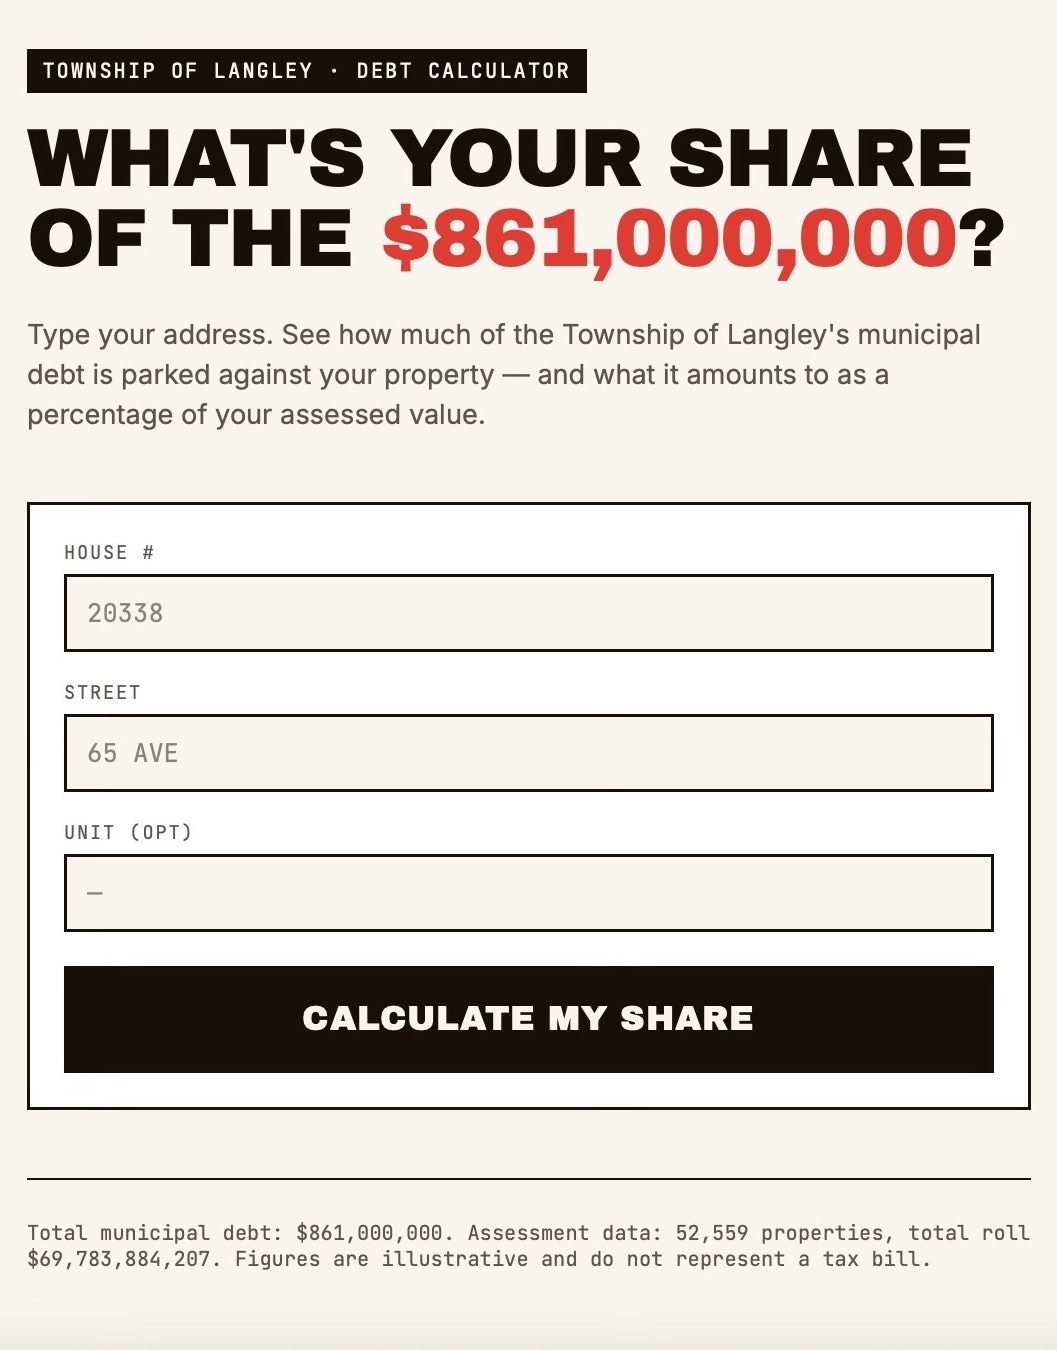
I was playing around with the Langley Tomorrow calculator that assigns a share of $861 million to individual properties. It is a pretty interesting way to look at the Township’s borrowing, but I wanted to verify the main claims before taking the number at face value. The post says it uses 2024 assessment data and also notes limits in the Township open data, especially around some farm and business properties.
Did Township debt rise from about $175 million to about $421 million?
Fact Check: Yes, but that is a narrow number
The 2022 annual report listed Debt and Agreements Payable at $177.1 million. The 2026 capital budget lists “Grand Total MFA Debt In Place” at $420.3 million.
MFA stands for the Municipal Finance Authority of BC. In simple terms, it is the main body used by BC municipalities for long-term borrowing. So when the Township refers to MFA debt, it is generally talking about long-term borrowing arranged through that system.
But this is also only one category, that is MFA debt already in place. If the broader $861 million figure is used as the comparison, the $420.3 million MFA debt in place is about 49% of the total. It does not fully capture debt in progress, internal borrowing, or other related obligations residents may reasonably want included when discussing the Township’s full borrowing picture.
Is $861 million a fair number to use?
Fact Check: Kind of
The broader number appears to combine several real categories. The 2026 capital budget lists $420.3 million in MFA debt in place and $182.4 million in new MFA debt in progress. Together, those two categories are about 70% of the $861 million figure. Langley Tomorrow then adds other borrowing categories, including Housing Trust and internal borrowing, to reach about $861 million.
That makes $861 million useful as a broader borrowing figure. But, I would not describe it simply as “long-term debt.” A more accurate description would be debt, borrowing in progress, and related obligations.
Additionally, Metro Vancouver reported in 2025 that the Township’s estimated annual debt servicing, including new proposed debt, was about $56.4 million against a $79.1 million liability servicing limit. That means the Township had used about 71% of its annual servicing room
The provincial limit is based on annual servicing costs, not the total face value of all borrowing. To go beyond that limit, a municipality needs approval from the Inspector of Municipalities, which the Province says only happens in extreme circumstances. For new long-term borrowing generally, the process also involves a loan authorization bylaw, Inspector approval, and often elector approval.
Does the calculator show what each homeowner actually owes?
Fact Check: Sort of
The calculator is not an official tool, it is more of a useful illustration. It spreads the $861 million across properties by assessed value, while the post itself notes data limitations.
The Township also explains that changes in property value do not change the total tax levy, because the tax rate is adjusted to collect the funds required.
So the calculator is just one way of showing a proportional share of the Township’s broader borrowing debate.
The takeaway here is that the $421 million number is real, and the $861 million number is built from real categories too. The difference is scope. One number shows debt already in place, while the other tries to show the wider borrowing picture. As new projects move forward, I hope council makes the borrowing behind those projects as easy to see as the projects themselves.
Agree with you that the numbers depend on how you scope them. I think it’s good that Mike’s numbers rely on the full scope because ultimately it all takes up space in our borrowing capacity and it’s all debt (or obligations) that Township residents are backstopping.